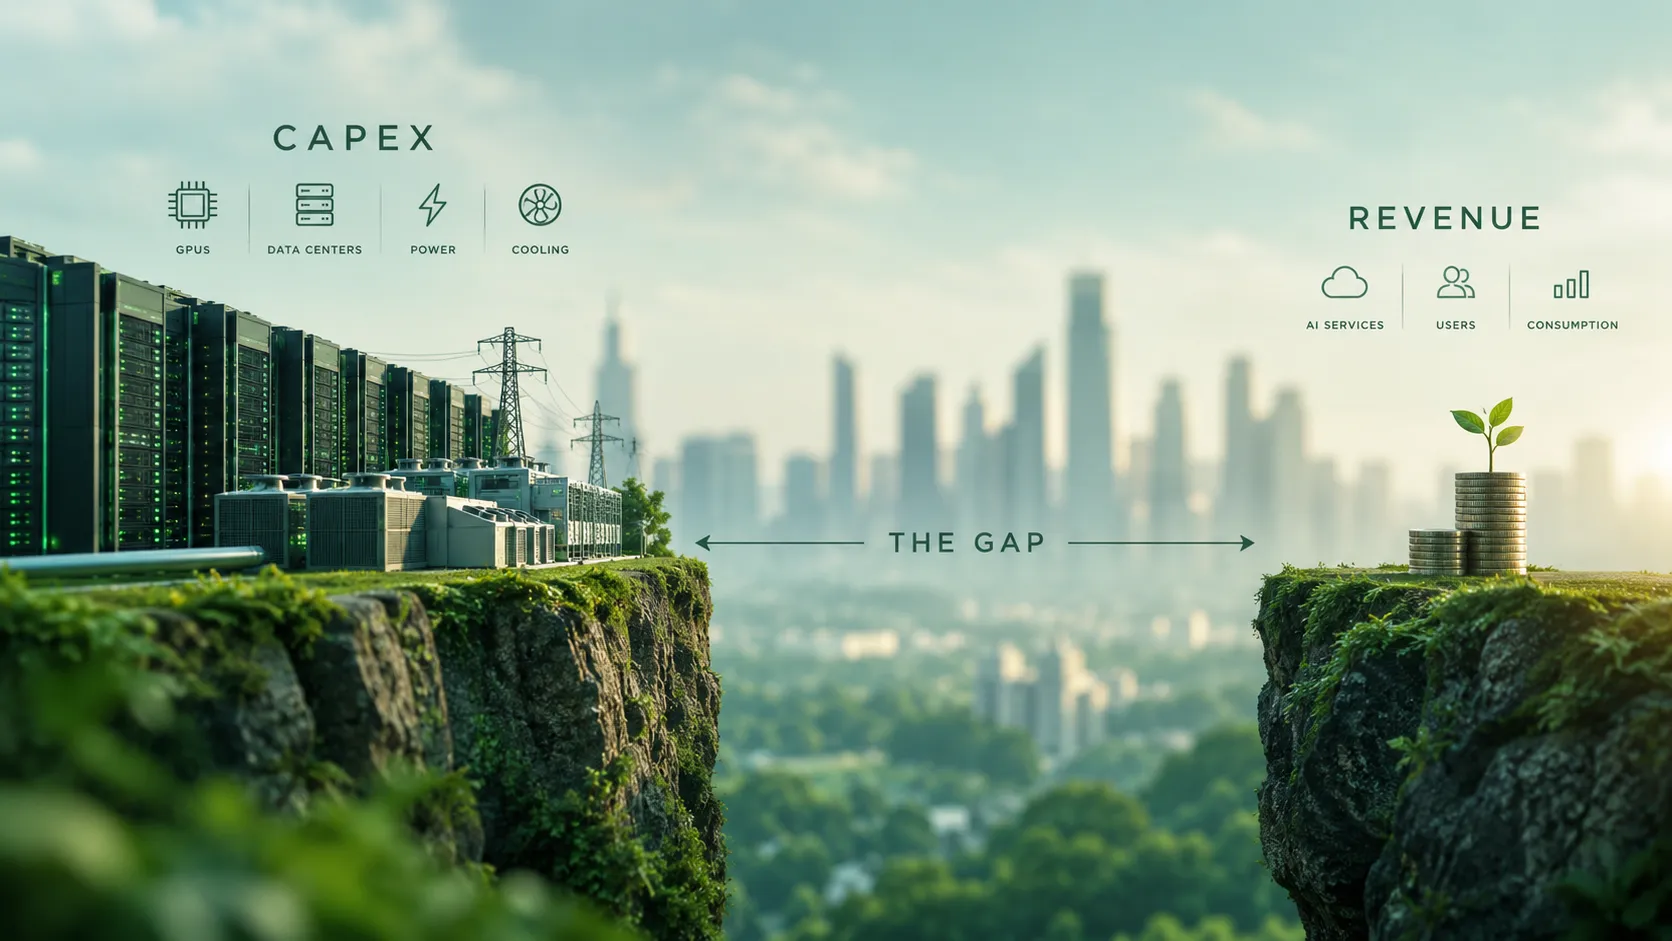
Most market sizings sold as “48-hour” jobs are, in my experience, a quick search followed by a lot of formatting. The analyst often grabs the first market report a search engine serves, wraps the headline number in a chart, and ships it. This walkthrough is quite the opposite. It will show what an actual AI-enabled 5-day study can do. We will use a market that’s growing very quickly right now: liquid cooling for data centers.
The client question, just how it would be in real life: How big is the data center liquid cooling market in 2026, and how fast is it growing? Since a lot of public material is available, such as independent analyst publications on the technology and market, filings from players involved across the value chain, an honest answer takes about 5 days, mostly because a fast answer can’t tell you where its number came from, and that’s the first thing I’d want to know about any figure going into a client deck.
Day 1: Define the market before you size it
Every downstream number inherits your scope decisions. For liquid cooling, e.g.: hardware only (cold plates, CDUs, manifolds, piping, etc.), or hardware plus installation and services? Manufacturer revenue or end-user installed spend? Direct-to-chip and immersion only, or rear-door heat exchangers too?
We scoped it as global, calendar 2026, direct liquid cooling for data centers, measured two ways: manufacturer revenue and end-user spend. I keep both measures because they answer different client questions. Mixing them up is probably the most common sizing error I see in published numbers.
Day 2: The discard phase
Search the market and the first page usually returns a wall of near-identical reports from commodity research houses, each with a precise-looking headline figure, a CAGR to one decimal place, and a purchase link. But put them side by side, and you realize their estimates for the same market in the same year differ by more than a factor of two, with no visible methodology explaining why.
If you can’t trace a number, it probably shouldn’t be in your model. I run every source through three questions before a figure goes in. One, can I see the methodology, or at least reconstruct what was counted? Two, does the publisher have specialist depth in this domain, or does it publish the same template across four hundred markets? Three, does the source have something at stake, e.g., analysts whose reputation depends on this specific coverage area? The commodity reports generally fail all three. I don’t think they’re malicious; they’re usually built to rank well in search, and accuracy tends to come second. When estimates disagree by 2x with no explanation, I refuse to average them, and I take it as a sign that the whole tier should probably be set aside.
What made it through the filter was a short list: Dell’Oro Group, a specialist infrastructure research house with named analysts covering this exact market; BloombergNEF for capacity data; company primary disclosures (earnings calls, capex guidance, product specifications, etc.); and public cost benchmarks, used with explicit flags. Spending a day throwing away the obvious answer can feel wasteful, but in my experience it’s often the most valuable block of the whole sizing.
Day 3: Build the trusted factual base
The independent analyst source: Dell’Oro expects the liquid cooling market to roughly double in 2025, reaching close to $3 billion in manufacturer revenue, and to scale toward approximately $7 billion by 2029. This is a reported claim, not a fact. But it comes from a house with named analysts, a stated scope (manufacturer revenue), and a business built on this coverage. Generally speaking, I’d rather have one credible number with a visible definition than six incompatible numbers without one.
The physical driver source: NVIDIA’s GB200 NVL72 rack draws roughly 120 to 132 kW under load; air cooling isn’t viable at that density, so direct liquid cooling is required. Microsoft confirmed in December 2025 that all future Maia accelerator deployments will use a liquid-default architecture. Dell’Oro projects leading-edge GPU thermal design power exceeding 4,000 W by 2029. Put together, chips are running hotter each generation, and the flagship racks already can’t be cooled with air.
The capacity wave: Over 23 gigawatts of data center IT capacity was under construction globally at the end of September 2025, per BloombergNEF, roughly three-quarters of it in the US. The four largest hyperscalers guided to approximately $630 billion in combined 2026 capex on their earnings calls, up from $388 billion in 2025. Both come from filings and calls, so anyone can check them.
Day 4: The bottom-up build
I try not to ship a top-down number I can’t rebuild from physical units.
Step 1, new capacity - From the 23 GW under construction and typical 12-to-24-month build timelines, we estimate 12 to 18 GW of new IT capacity energized during calendar 2026. This is an inference from two facts, and it’s labeled as one.
Step 2, liquid share - With flagship AI racks liquid-mandatory and at least one hyperscaler liquid-default, we estimate 35 to 50 percent of 2026 additions ship liquid-cooled. The published cooling facts underneath are the strongest; the percentage is our judgment, and it’s something which also requires expert opinions - hint: see if your org has people with subject matter expertise or if you can arrange budget to run a few primary calls with experts in the field.
Step 3, unit cost - Practitioner deployment guides benchmark liquid cooling at $1,000 to $2,000 per kW of cooling capacity for equipment, with installed direct-to-chip costs quoted higher at the facility level. These are single-source-grade benchmarks; you can connect with a few industry experts to verify things if budget permits.
Honestly, this is the part that can take a day to multiple weeks depending on how complex you want your model to be and how much of it is readily available or can be reasonably estimated. This is the primary part where you have to judge and present different pricing options and levels of confidence for your research to project sponsors.
Day 5: Triangulate, stress, write
Next, check the two independent methods against each other. Dell’Oro’s trajectory (roughly $3 billion in 2025, plus the current growth rate) implies manufacturer revenue in the $4 to 5 billion range for 2026. The bottom-up build, run at equipment-level costs and a conservative liquid share, puts its lower half in the same range; run at installed costs, it points to total end-user spend meaningfully higher, plausibly $6 to 9 billion. The reconciled finding: roughly $4 to 5 billion in 2026 manufacturer revenue, with total end-user installed spend materially higher, and a credible path to Dell’Oro’s ~$7 billion manufacturer figure by 2029. The two methods were sourced separately and converged in roughly the same place, which gives me reasonable confidence in the range. Just a quick heads-up here - this triangle has two legs, not three. A supply-side check against vendor segment revenue is the missing piece, and depending on the budgets available that I mentioned in step 4, this can be further refined.
For the watch list
Speculations: NVIDIA’s roadmap points toward 600 kW to 1 MW racks in the Rubin era. If that ships on schedule, cooling would likely move from a procurement line item to something designed alongside the rack itself, and most current forecasts would probably turn out too low. The indicator I’d watch is two-phase cooling moving from pilots to volume purchase orders.
The deliverable is built as a Pyramid. Data is the trusted base above; Insight is the market value at $4 to 5 billion in 2026 manufacturer revenue, likely doubling by 2029, and the first page of syndicate search results was off because those reports measure different things without saying so. Implication and Action is written for whoever sponsored the work - this part is customized to the sponsor’s problem statement, with a 30-day re-test against new facts and hyperscaler capex revisions.